The metrics
One definition per metric, at every property.
Rooms sold ÷ physical room count. The denominator never moves.
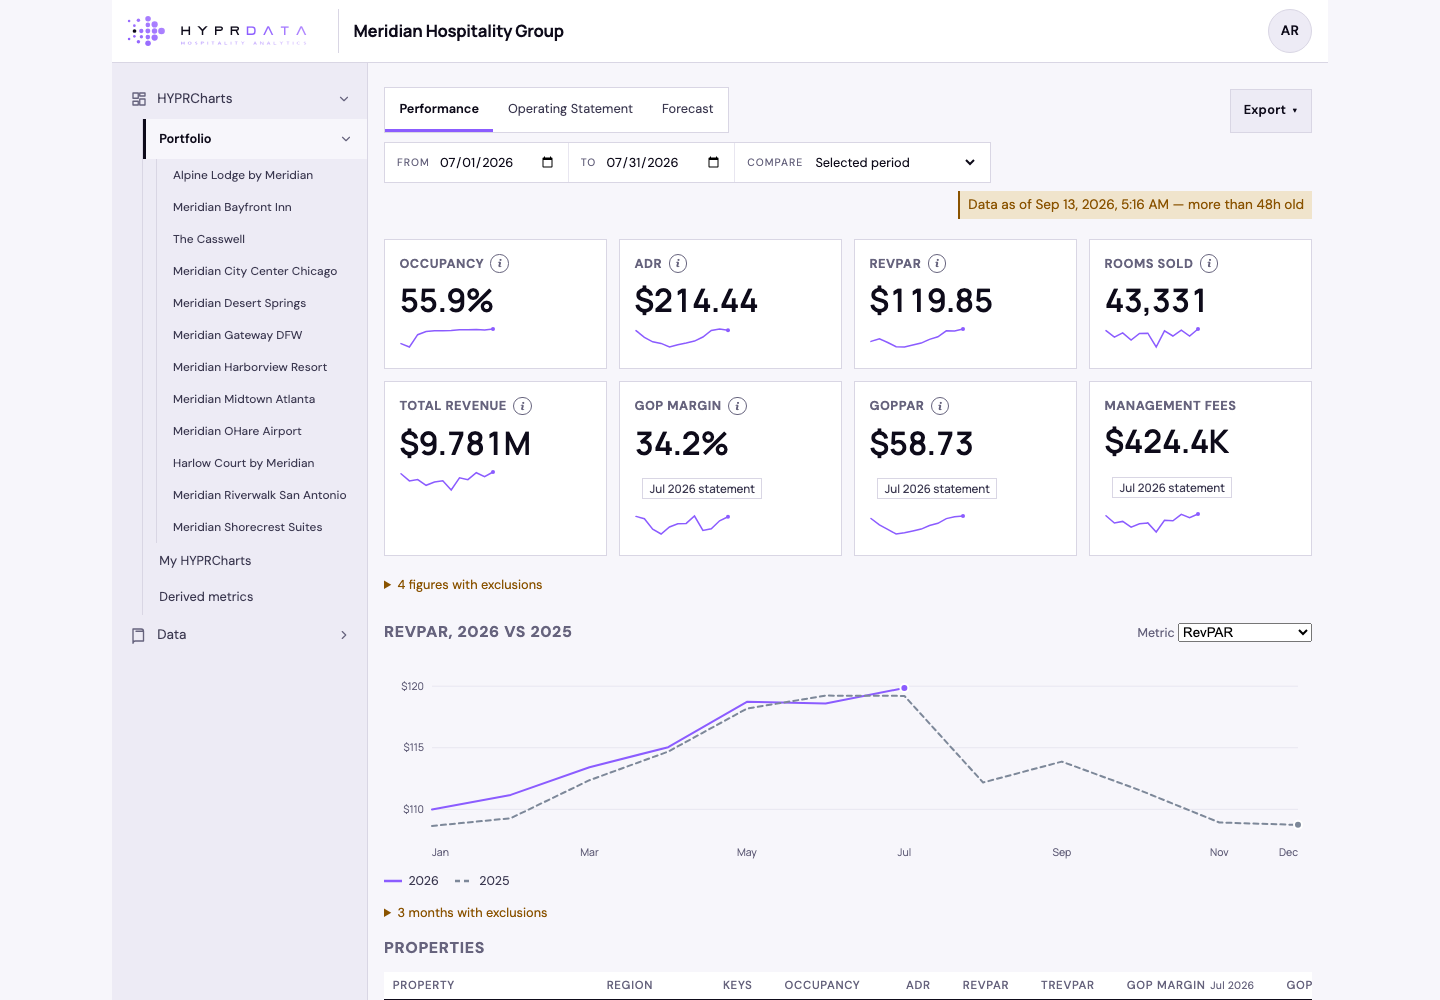
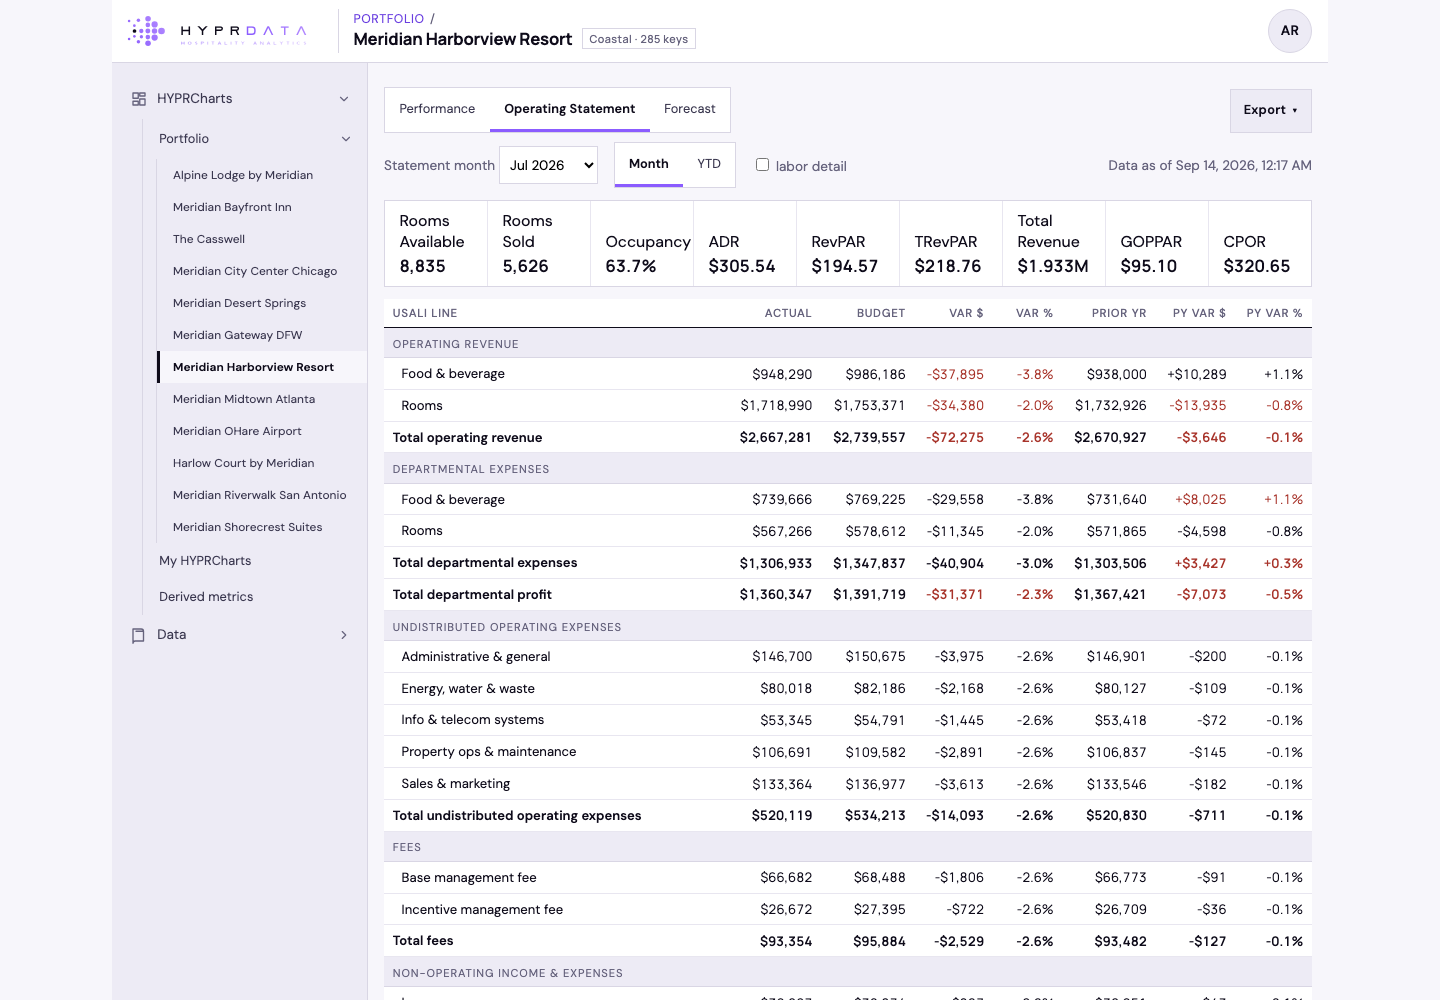
Every answer about one property or fifty, on screen in seconds and already reconciled: read-only from the systems that run each hotel, on one basis, traceable to the record that produced it, and dated to the minute it was last read.
Request a walkthrough Tap any hotel below.What it does
A read-only layer over the systems that already run each hotel. It pulls, matches and explains the numbers, so your team starts from an answer instead of a spreadsheet.
Every property is measured with the same definitions. A portfolio figure is a true recomputation, not an average of averages pasted together by hand.
Each property is re-read on schedule and the figures are on screen in seconds. Every view states when its data was last read, and warns when a source runs stale.
Missing days and unmapped lines are flagged with a reason, never estimated or silently dropped. Provenance travels with every figure.
The basis
Every ratio is recomputed from underlying totals at whatever level you are looking at. Switch the method and watch the same ten reporting hotels deliver a different month.
Total room revenue ÷ rooms sold, July.
The metrics
Rooms sold ÷ physical room count. The denominator never moves.
What's in it
Occupancy, rate and pace sit next to labor cost, flow-through and margin, in one vocabulary. No PMS export to line up against the P&L by hand.
Open any hotel and its USALI operating statement sits beside occupancy, ADR and RevPAR, actual against budget line by line. Nothing is forced to tie: an unmapped line shows as “financials incomplete” and waits in a mapping queue, never folded into a total.
Every source is read, matched and checked before you log in. A morning of chasing feeds becomes a status column: each property’s last read, record count and reason, with rejected records shown as counts, never contents.
Click a tile and the chain opens: the definition and its version, the build it came from, the properties in scope, the exclusions with their reasons. Every figure is recomputed from record-level source, not a rollup of someone’s earlier rollup.
Build dashboards from the standard tiles and derive new metrics from them. A formula runs across every hotel at once, under one approved definition; a name too close to a standard metric is refused, and a new one waits for a second steward’s approval.
Load the operator’s own reforecast as a versioned scenario and it sits beside actual and budget, summed and differenced for you. Nothing is projected by the product. Rooms on the books compares today’s position with the same lead time last year, and says so where last year is reconstructed.
CSV, Excel with native charts, PDF, or a one-click image. Every export carries its period, scope and data-as-of stamp, and every export is recorded in the activity log.
Executive, regional lead, general manager, steward, administrator: the role travels with the login and is enforced at the server. A request outside it is refused and logged.
A lobby at six in the morning on a phone, not two monitors at a desk. The GM and the asset manager see the same timestamped figure, so nobody asks how fresh it is.
Every portfolio figure is recomputed from the underlying totals at whatever scope you are looking at — a region, an owner’s hotels, the whole group — with the properties that did not report named beside it, never averaged over.
The limits
Constraints on how the product is built, not preferences. They are the reason it is safe to connect.
Read-only against every source, permanently. It cannot change a reservation, a rate or a folio, so connecting it cannot break a hotel.
Operational truth stays where it is created. This is a mirror of your data, never the place it lives.
A property that did not report, or a day that failed validation, shows as missing with the reason — never quietly estimated or averaged over.
Guest identifiers are never extracted and cannot be recovered from the product. It explains how classes of guests behave; it never tells you who someone is.
If we correct how a metric is calculated, affected dashboards carry a notice for 30 days saying what changed and by how much — and the previous basis stays available.
Where this goes
Multi-currency, multi-region reporting and a mobile app are on the same path, each proven against real portfolio data before it ships.

One property or fifty, reconciled and traceable to the record.
See two years of your own portfolio on one basis, each number traceable to the day it came from. We are onboarding a small number of multi-property owners and management companies alongside our development partner.